Create a business dashboard from Cloud Logging logs using Looker Studio

A few months ago, I created a POC for a startup client to visualise their new user registration data. This use case can be interesting for small companies who need a quick way to create a business dashboard. I would like to share it with you.
Logs
Assuming you run your business on Google Cloud. Your API is powered by Cloud Function. When there is a new user registration, the Cloud Function instance writes a log to Cloud Logging.
Create a Log Sink
Sinks control how Cloud Logging routes logs. Using sinks, you can route some or all of your logs to supported destinations.
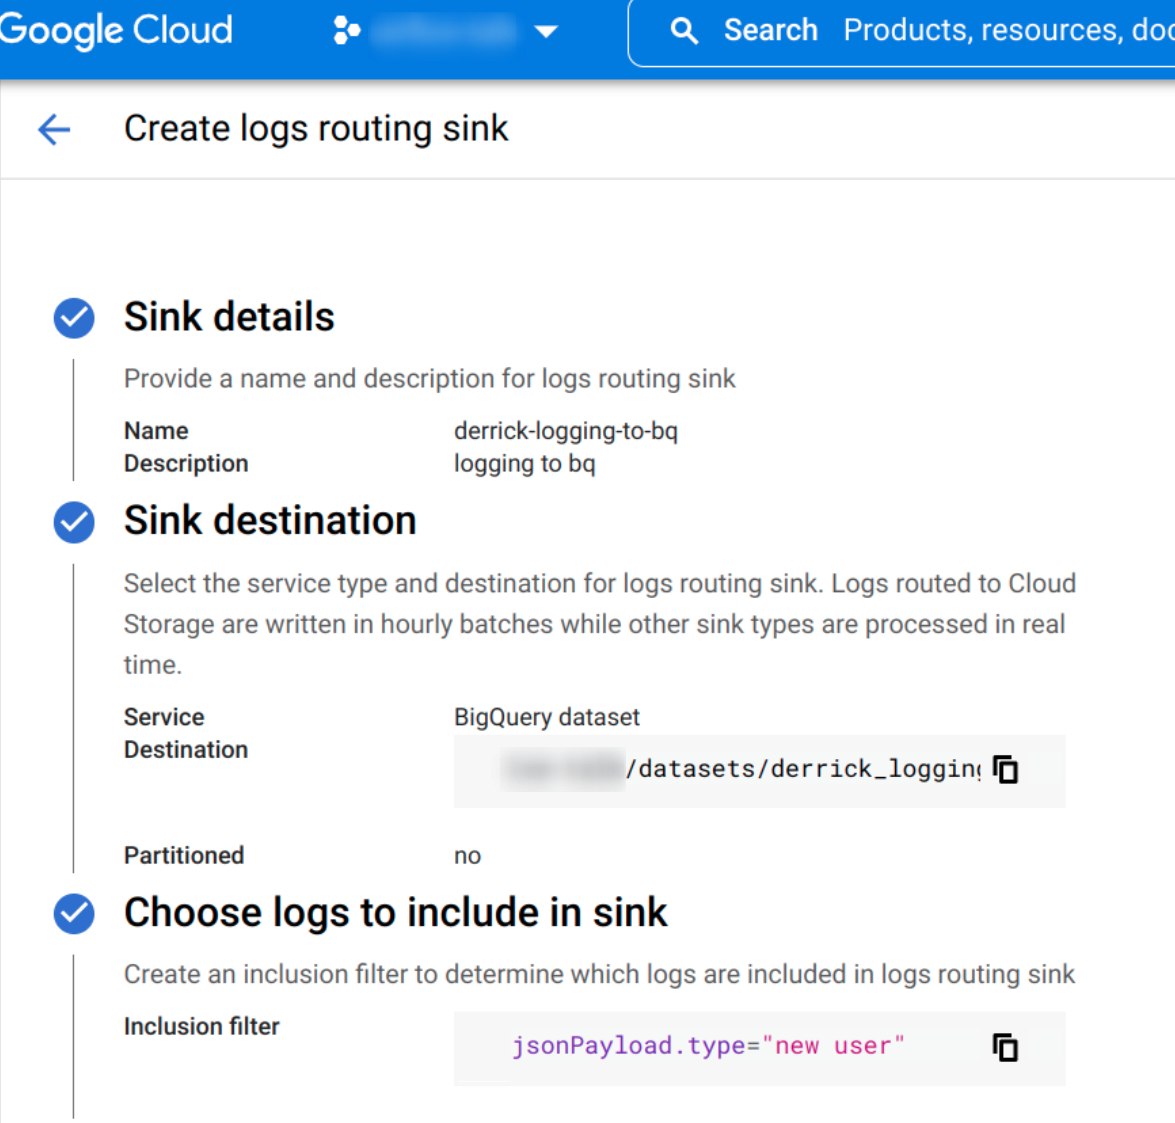
From the Log Sink page, click CREATE SINK. When creating the sink, route the logs to BigQuery:
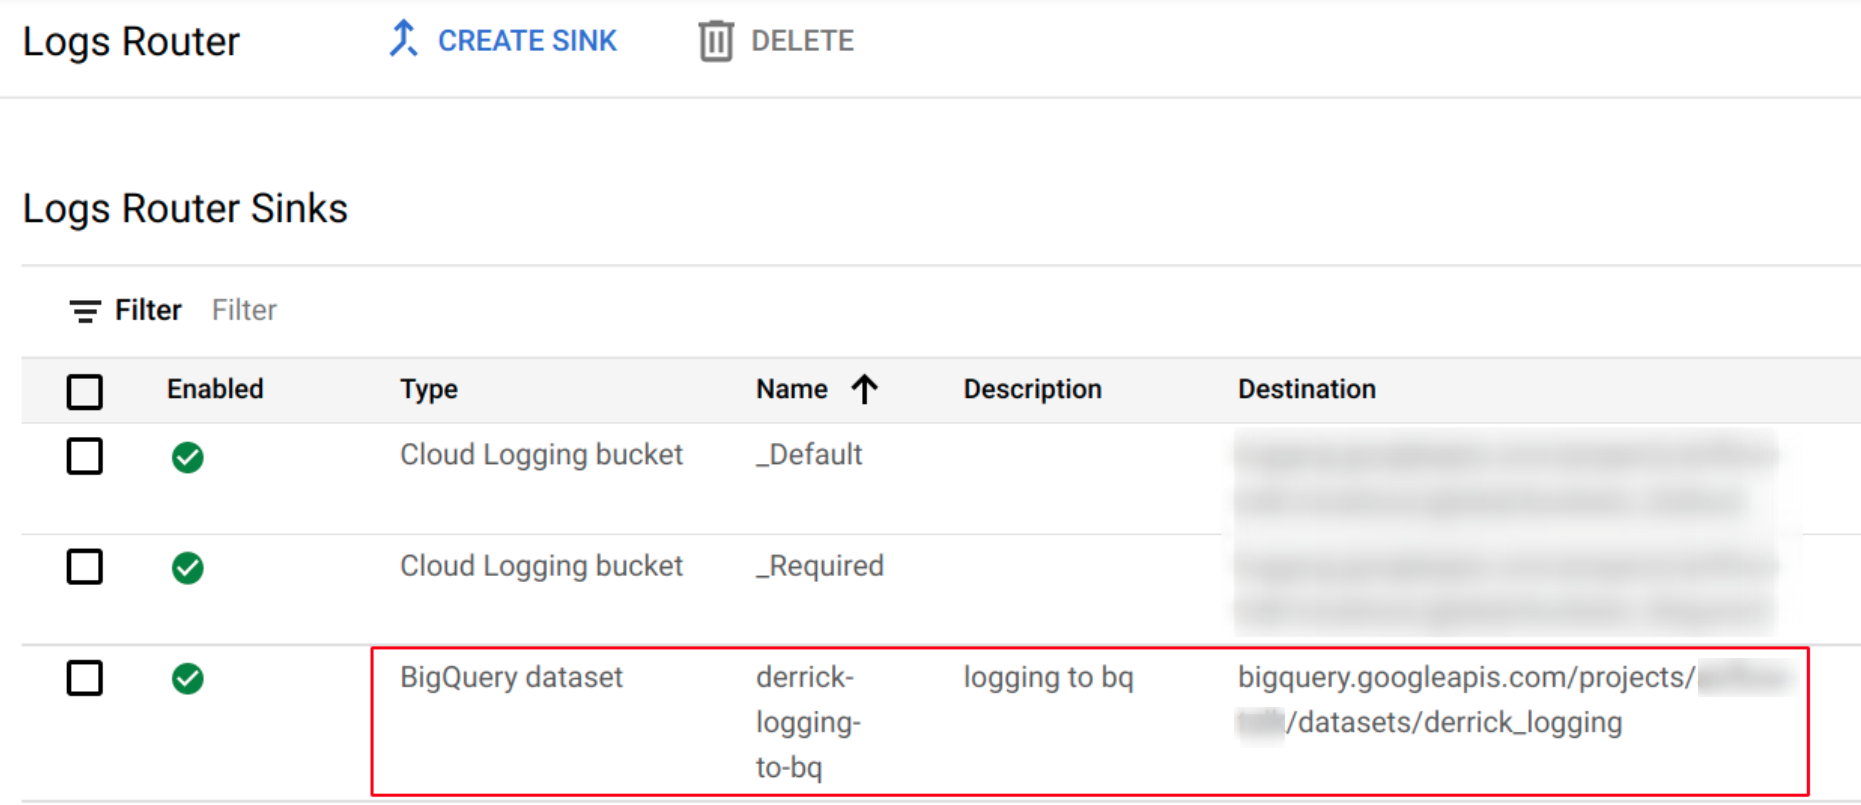
After creating the sink, it looks like:
A new BigQuery table was created:

Write some logs
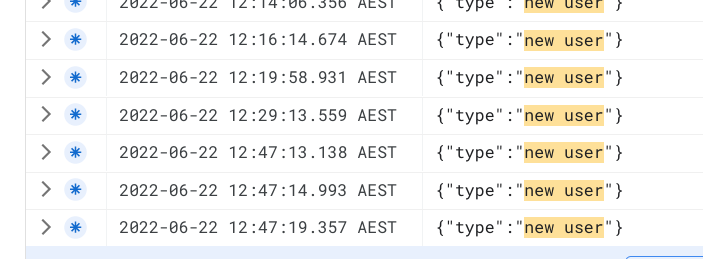
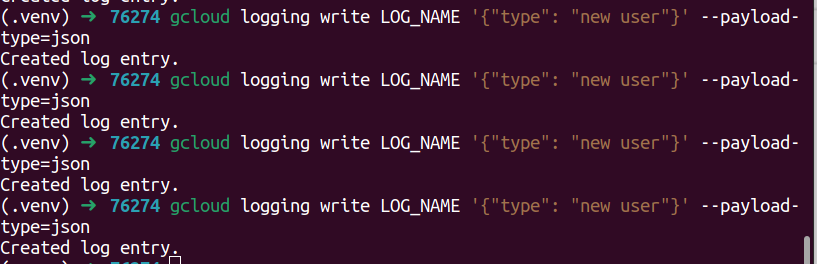
Now I put a few logs to Cloud Logging via gcloud command:
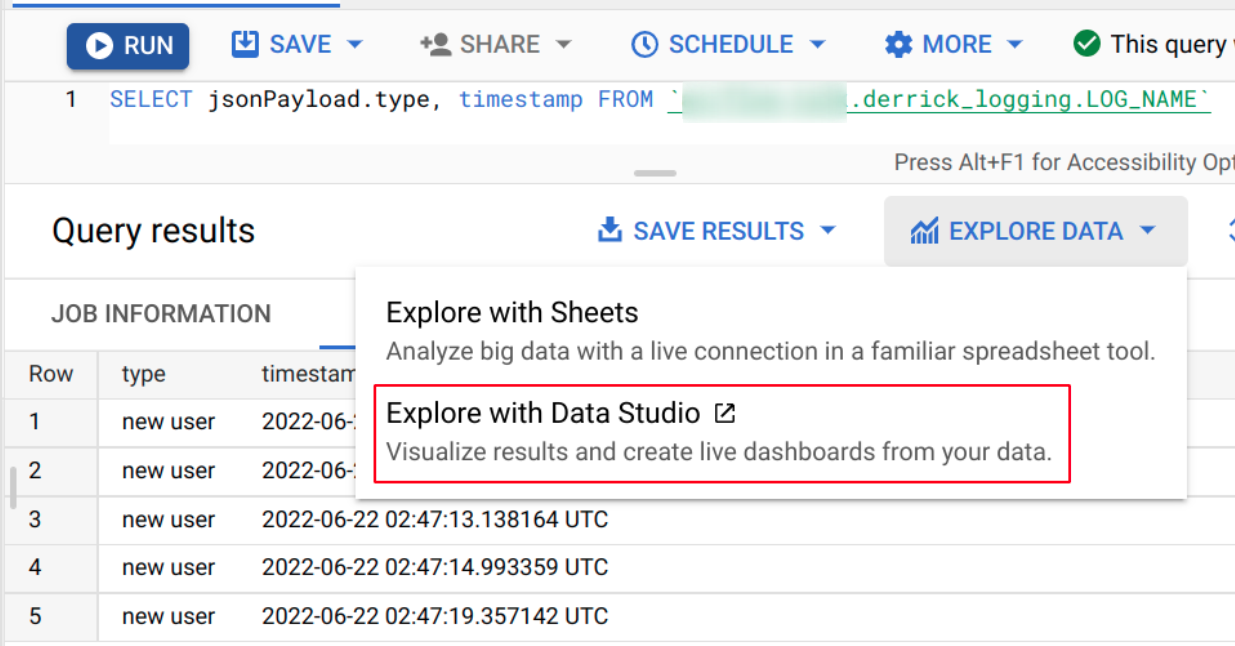
Query the logs and navigate to Looker Studio
On Looker Studio(formerly Data Studio), I built a simple dashboard:
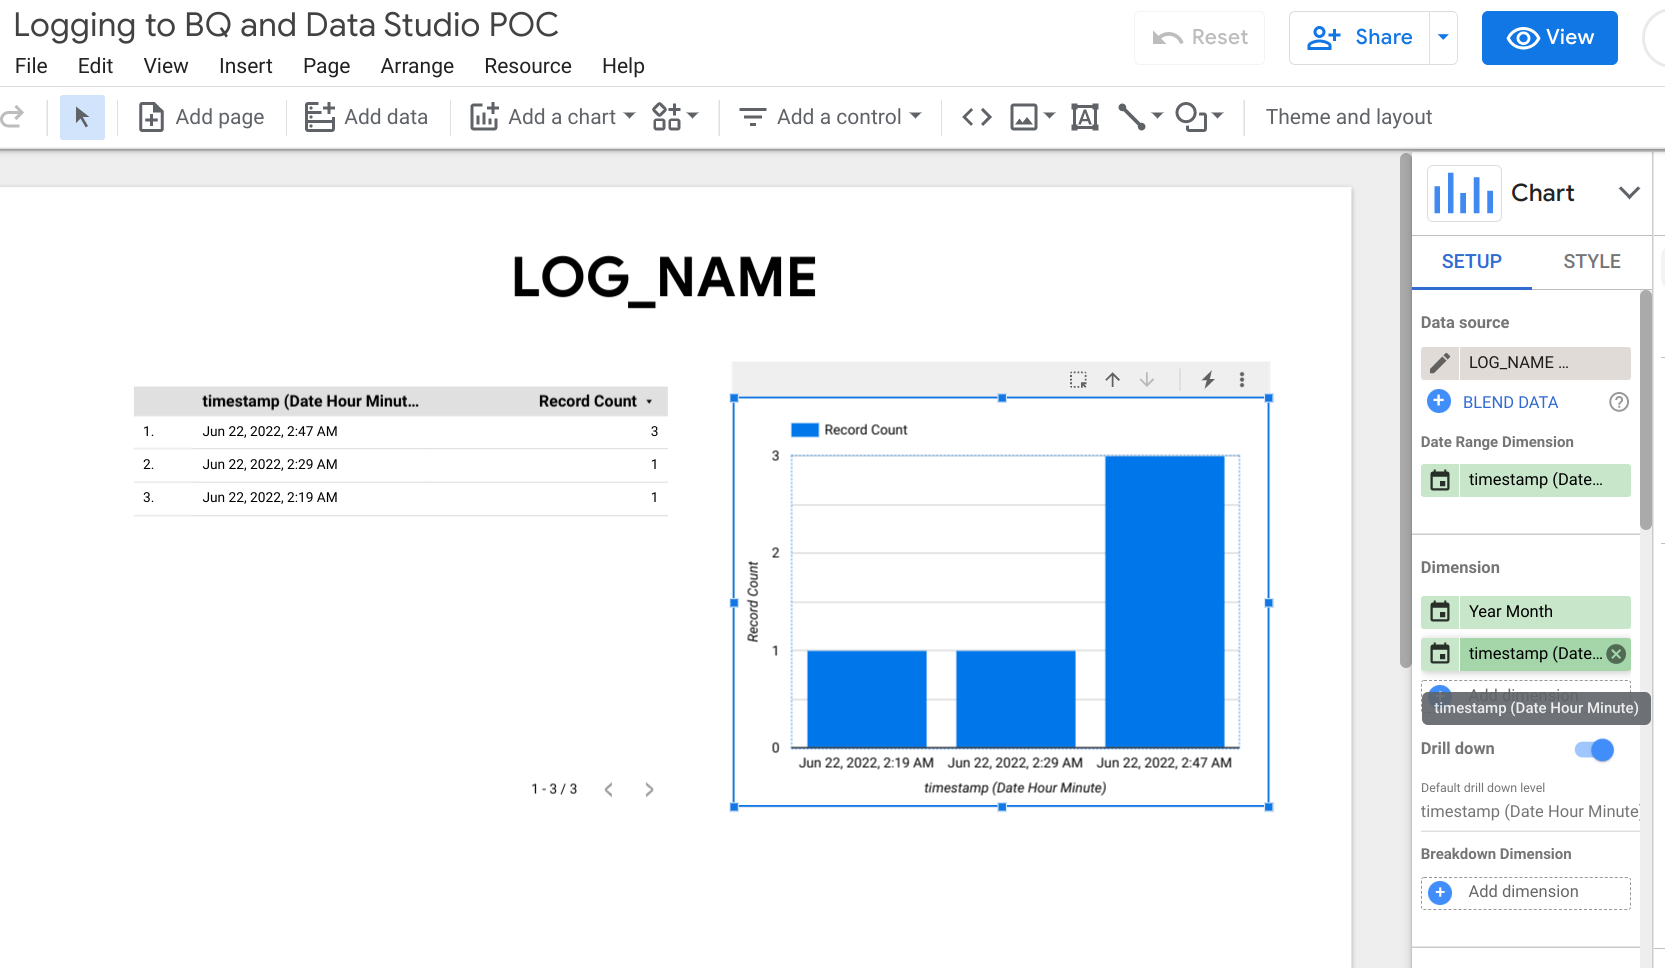
Note that, for testing purposes, I had to switch to minutes so we can see a few bars, but in most cases, the time interval should be hourly or daily.
Summary
Using Cloud Logging, BigQuery and Looker Studio, you can quickly build a dashboard to visualise business data, such as user registrations.